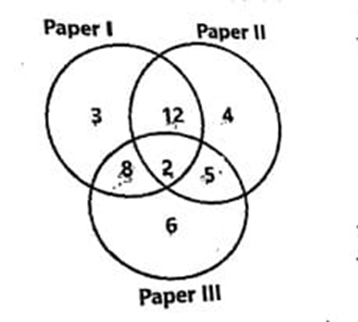
4. The numbers given inside the Venn Diagram below indicate the number of persons reading newspapers of the three types. The diagram is drawn after surveying 50 persons. In a population of 10,000 how many can be expected to read at least two newspapers?
5000
5400
6000
6250
Correct Answer :
5400
Solution