Directions (Question Nos. 40 to 42) : The following line graph represents the number of trainees who joined and left the company in the beginning of the year for six years, from 2000 to 2005. The initial strength of the company in 2000 was 1500.
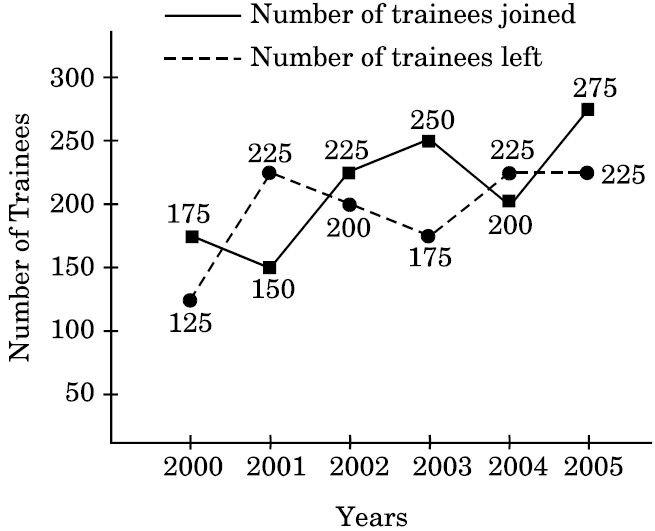
40. The number of trainees in the company increased/decreased from 2001 to 2002 by approximately what percentage ?
1·2%
2·1%
1·7%
2·3%
Correct Answer :
1·7%
Solution